Eight Tips for Better Engineering Calculations in Excel
February 24, 2021 • calculations excel
I’ve heard it said more than once - Excel is the world’s most widely used programming environment.
This certainly matches with my experience. Everyone has excel, it can do math, and it is pretty easy to format things to print on the page.
Personally, I think Excel is limited at best as an engineering tool. The lack of unit awareness and difficulty in creating “user commentary” are some of my key concerns about developing calculations with this tool.
Nevertheless, most of us will end up creating calculations in Excel at some point. So below are some of the simple steps I recommend for creating Excel calculations which are easier to read, update, QC, and re-use.
Label things clearly
Show clearly what is an input, what’s a calculation, etc. using headings or other means.
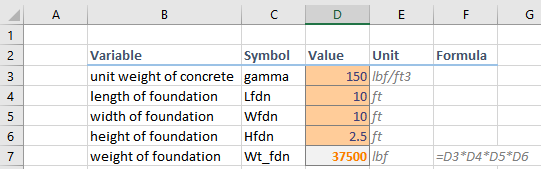
Use cell styles
Cell styles help to visually differentiate what is going on with your sheet. Excel conveniently has many built in styles & labels to make it easier to consistently select the same styles for the same type of information. You can also modify these if desired.
Here I’ve added a heading style, input style, and explanatory style. We can see that this already helps to differentiate what I’m communicating about these values
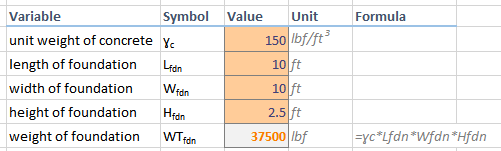
Name variables - use Unicode and subscripts
Say we want to perform a calculation using the unit weight of concrete. By naming our cell, we can make our calculations much clearer.
Using Unicode also makes our names more succinct, and lets them better match the code / design references. If you put the symbol to the left of the value, when you right click to name the cell it will automatically use the values in the adjacent cell.
compart is a simple way to find relevant Unicode characters - you can search by spelling things out, like “gamma”, and then copy over the relevant symbol to excel.
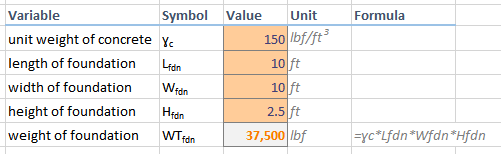
Use =FORMULATEXT() to display equations
A huge benefit of using Unicode to name variables is that your formulas will now be human readable, even when printed and cell labels are not available.
I strongly recommend using FORMULATEXT vs writing out what an equation is supposed to be by hand, because with the latter it is possible to correct what is displayed, but not the actual math being performed.
Apply number formats appropriately
Allow the thousands separator, and adjust the number of significant figures as appropriate for your calculation.
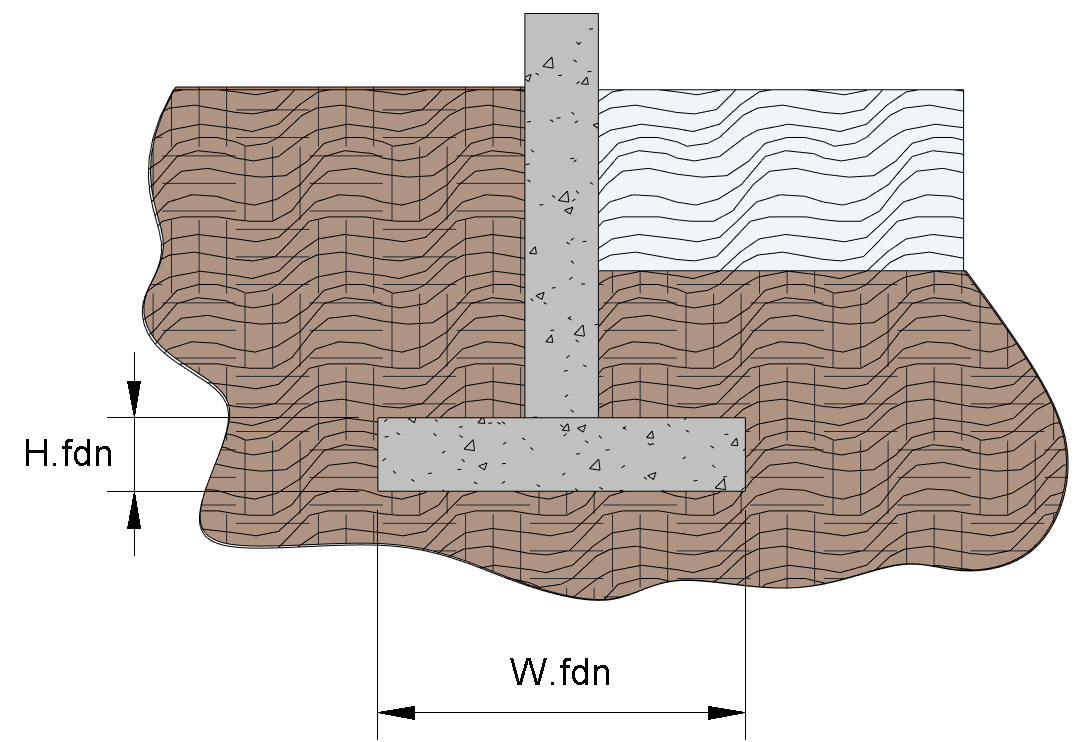
Include figures
There are a few ways to approach creating figures in Excel.
One method I have used is creating figures in Revit, often just using filled regions. I’ll rename dimension strings in Revit to match the symbols in Excel. You can’t do subscripts in Revit’s dimension strings, so the formatting won’t match exactly.
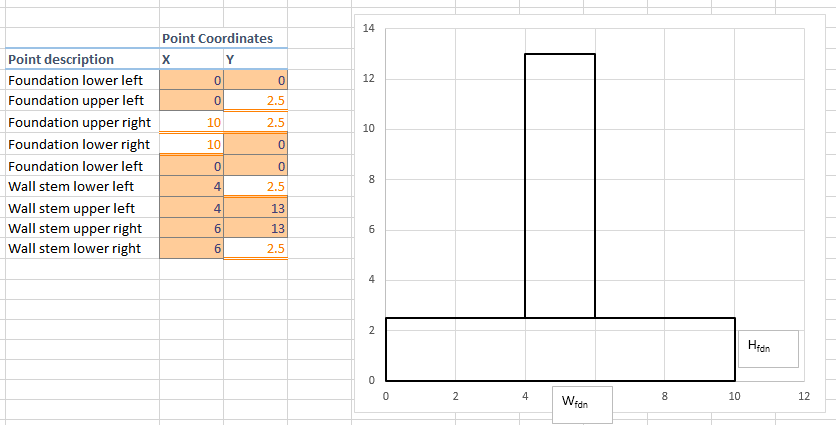
Another possible method is by producing graphs in Excel itself. This is something I’ve seen done more than I have actually performed myself, but it would look something like what I’m showing below. The big thing I haven’t worked out with this method is how to nicely label the dimensions / variables in the graphic I’ve created.
Use groups
Sometimes in Excel it can be helpful to break more complicated logic down into smaller steps. However, these smaller steps are not always appropriate / relevant to include for the printed document.
One way I have found to manage these steps is to use the Data → Group function in excel. This allows you to “group” a number of rows or columns together, and quickly collapse or expand them as needed. I’ve used this to create more detailed logic in the appropriate place in a spreadsheet, and then collapse. This helps with future use / reuse because all the logic is one place, and fits into the normal “flow” of the spreadsheet, but can still be hidden when it isn’t relevant to include.
I’ve used this is for looking up the required factor of safety for sliding based on the structure information and the EM 1110-2-2100 Tables 3-2 and 3-3. As you can see below, I’ve reproduced the information from Tables 3-2 and 3-3. I use user inputs of the structure information to perform a lookup and return the minimum FS.
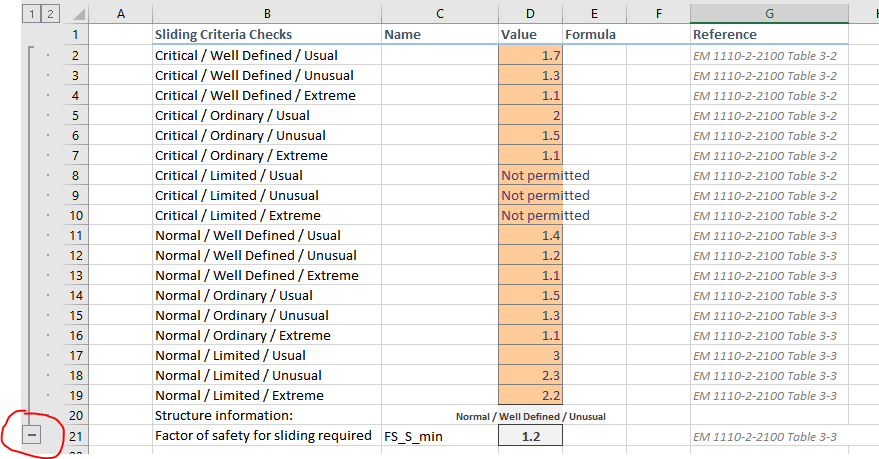
That minus symbol in red is the group, and when collapsed all that is visible is the relevant output and table reference.

Break things up across sheets
Another general practice I’ve adopted in excel is to try and keep information on a single sheet to what will fit on a single page.

I’ve found that if a calculation is getting longer than a single page, it is helpful to break it up into parts and use the sheet names to help make the calculation easier to navigate.
This also helps avoid producing spreadsheets which are very large and have inputs which can be missed if you don’t scroll over or down far enough to see relevant inputs. I’ll often have a summary tab, an inputs tab, sometimes a separate elevation input tab, and then relevant calculation tabs as required.